D. Addressing Affordability
99. Although tariffs have increased over the past decade, current levels are still affordable for the average consumer. Real tariffs have increased by 5 to 10 percent per year, on average, over the past decade, but clearly so have disposable incomes among residents. Computing reported expenditure on water and wastewater as a share of income for different income groups reveals that the average expenditure is well below the 5 percent threshold33, with the highest shares of 4.4 and 4.2 percent observed in Ukraine and Romania, respectively. Both countries also show the highest share of households that have water and wastewater expenditure above 5 percent (32.5 and 28.8 percent for Ukraine and Romania, respectively).
100. Estimations of the expenditure share for the bottom 40 percent show a slight increase, but affordability constraints are prevalent only in Ukraine and Romania. There, more than half of households among the bottom 40 percent face a water and wastewater bill above 5 percent of their income, and people within that income group pay 5.8 percent, on average, for water and wastewater services. Computing the expenditure share of the extreme poor (that is, those living on less than $2.50 a day [purchasing power parity, PPP]) shows only Romania having viable statistics (that is, a sufficiently large sample size), according to which the poorest pay 5.1 percent of their income for water and wastewater services. Not all countries have household surveys that report water and wastewater expenditure separately from other utility or rental expenditures, but those that do are reported here and in Figure 61.

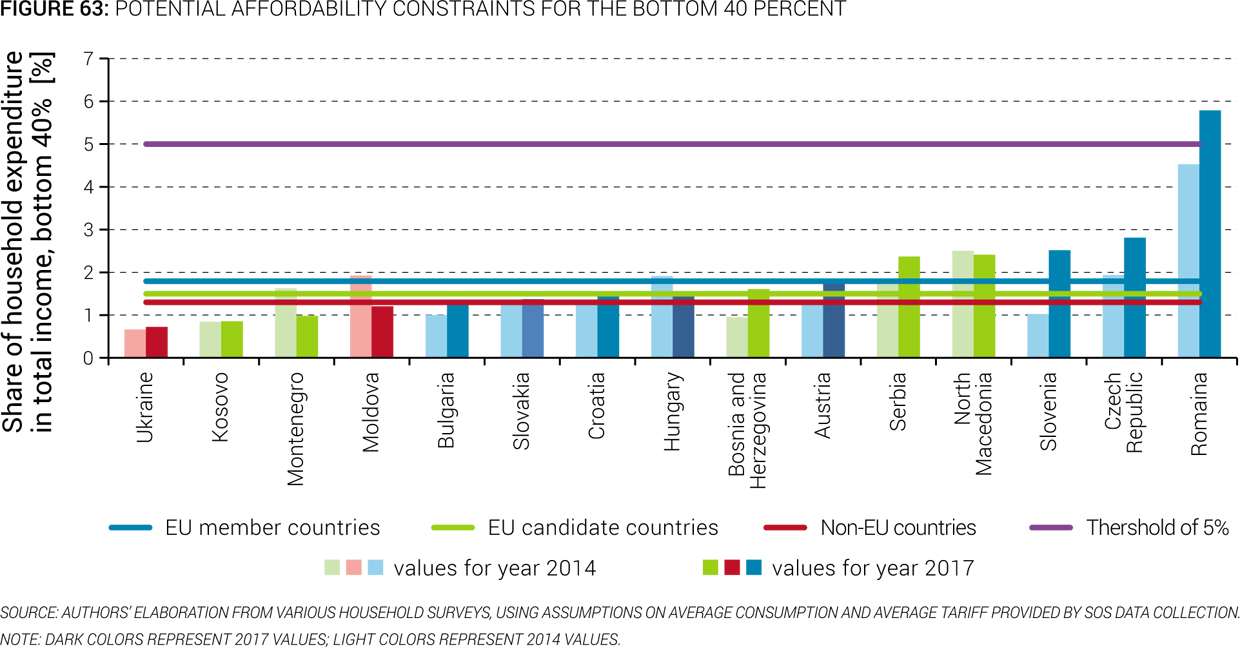
101. When assuming that the entire population would be connected to piped water and sewage services at an average consumption level and prevailing tariffs, affordability constraints emerge in Romania. Using reported country statistics on average tariffs and average consumption per capita per day, expenditure for water and wastewater collection and treatment were computed for each household, taking into consideration the size of household and income as reported in the household surveys. The share of the computed expenditure in total household income was subsequently calculated to understand whether average expenditure on water and sewage—at income levels reported in the household surveys—would exceed recommended thresholds. Under these assumptions, Romania shows expenditure for water and sewage services above 2.5 percent of income for the average citizen and near 6 percent for the bottom 40 percent of income distribution. (Figure 62 and Figure 63). Compared to three years ago, the affordability situation with regard to water and wastewater expenditure seems to have worsened in most of the countries of the region. Countries with improved affordability, like Montenegro, report lower consumption rates and in some cases, decreases in (WSS) tariffs.


102. Several countries have defined thresholds to identify affordability constraints at much lower levels than 5 percent. For example, Bulgaria sets an affordability limit of water and sewage expenditure at 4 percent of the average disposable household income, and if the entire population were covered under the outlined assumptions, Bulgaria’s bottom 40 percent of households would hit that limit. Croatia uses 2.5 percent of median disposable household income, and the Czech Republic designates 2 percent of the average net household income as the threshold. Under given scenarios, the Czech Republic would exceed that threshold slightly for the average income earner and more so for the bottom 40 percent, yet current average consumption in the Czech Republic is also lower (88 liters per capita per day) compared to what has been assumed as basic, but sufficient consumption. Both North Macedonia and Montenegro use 5 percent as the threshold and would face no affordability constraints for either the average income recipient or for the bottom 40 percent. Bulgaria and the Czech Republic also define what constitutes minimum consumption, which, respectively, is 90 and 80 liters per capita per day.
103. Only Croatia, Hungary, North Macedonia, Slovenia, and Ukraine report having formal subsidy schemes to ensure affordability for low-income earners. In Ukraine, different subsidy schemes (general low-income family and housing and utility programs) are available for households, administered at the central level and with resources coming from central budgets. Hungary’s subsidy is administered centrally, but other than in Ukraine, the subsidy is targeted to utilities that, though run efficiently, face higher cost of service provision (due to location, economies of scale, or other factors) and is passed on to consumers through lower tariffs. In Croatia, cross-subsidies among different consumer groups is commonly applied, combined with the identification of low-income households that are entitled to a lower tariff on the first block of an increasing block tariff to ensure minimum consumption. Minimum consumption at subsidized rates is also enabled for low-income groups in North Macedonia and is administered at the municipal level. Similar provisions are available in Slovenia, though they are rarely applied. As shown in Section A of this chapter, in practice, governments in most Danube water countries subsidize their local water and sanitation services from a combination of taxes and transfers, if needed, even if such arrangements are not formalized or targeted.
104. The performance of subsidy schemes ultimately depends on what percentage of the subsidy reaches households in need of such subsidy. Subsidies delivered by charging tariffs below cost or through transfer from local government to utility budgets are not targeted, and one would expect a large part of the subsidy to be leaked to households that are not poor (the so-called “errors of inclusion”). Means-tested programs, often applied in combination with other social protection efforts, have a higher chance of reaching the poor, but only when the criteria to identify poor households are rigidly applied. The example of the low-income family allowance in Ukraine demonstrates that the targeting performance of this means-tested program is relatively high—with the lowest 20 percent earners receiving 78 percent of the subsidy. Since 2014, there have been various reforms to improve the provision of housing subsidies. The latest reform from January 2019 improves targeting to the poor and is now based on cash payments made for housing expenditures.

