C. Overall Performance Trends and Drivers
74. In the SoS 2015, an econometric analysis of utility performance trends and drivers was performed to complement the descriptive analysis of sector performance. Such an analysis makes it possible to analyze the data more rigorously and draw conclusions that are substantiated statistically. For that purpose, the most recent IBNET/DANUBIS.org dataset was used to update the Water Utility Performance Index (WUPI), a specific performance index calculated by the author team (see box 8) to measure the overall performance of utilities (in terms of service coverage, service quality, and management) against various parameters. The IBNET dataset is not representative in all countries: Albania, the Czech Republic, Kosovo, Moldova, and Serbia are the most complete, while Austria and Slovenia are entirely missing; data are dated in Hungary, the Czech Republic, and Romania and very partial in Montenegro and Ukraine. However, the results here include conclusions that have been thoroughly vetted. More details about the corresponding analysis can be obtained in the methodological note in Appendix B.
Box 8 Water Utility Performance Index
The WUPI is a simple index measuring how close a utility company operates to accepted good practices. The Index is based on 10 dimensions generally accepted as key performance indicators in the industry and available from the IBNET/DANUBIS.org dataset. Those dimensions are grouped in three categories: coverage (water supply, sewer, and wastewater treatment); quality (service continuity and sewer blockage) and management (metering, NRW, Staff productivity, collection rate, operating cost recovery). For each dimension a 1–10 score is computed measuring how close a given utility is to regional good practices. The sum of all scores gives the WUPI, with 100 (best practice on each dimension) being the best score. For more details refer to Appendix B.
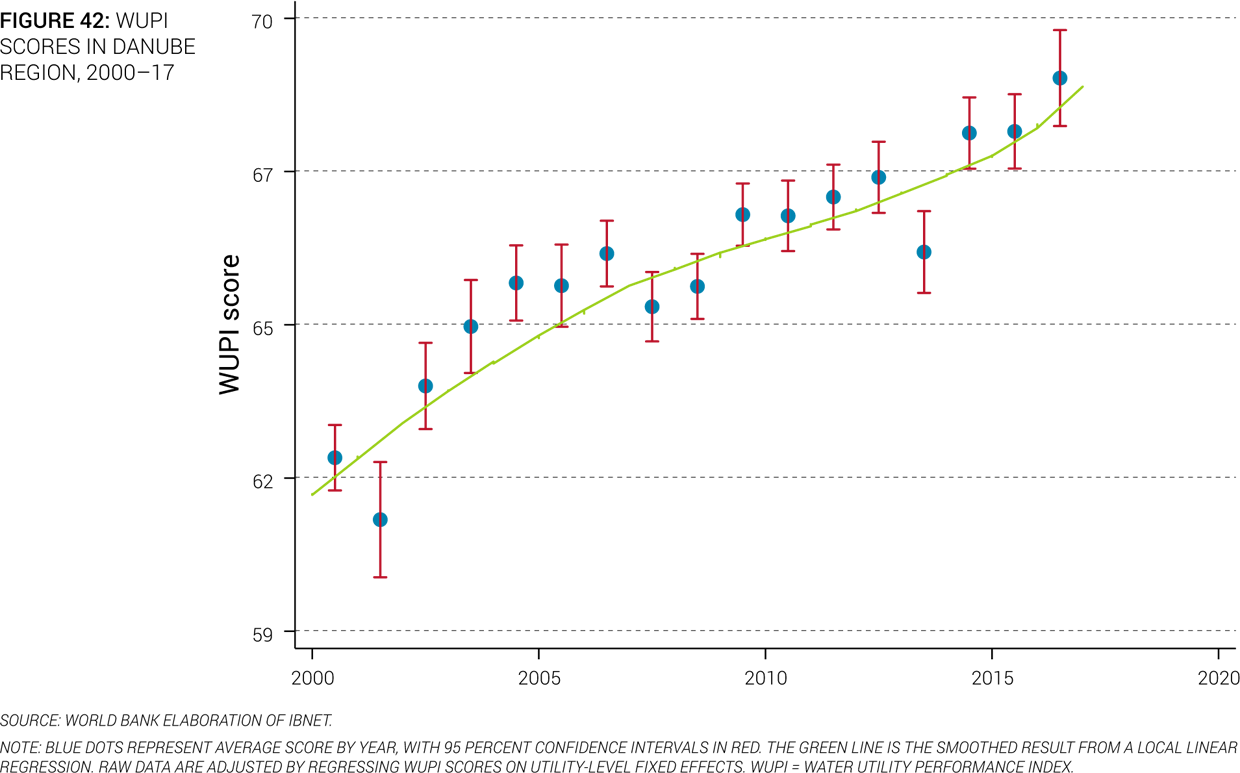
75. Utility performance in the Danube region has further increased since 2013. Overall, the increase over all utilities was 5.2 points, and 4.2 points accounting for the fact that the underlying sample of utilities changes over the years.27 As shown in Figure 42, this improvement follows the long-term trend since 2000, but has been slightly increasing in recent years. Albeit some diverging trends within countries, WUPI scores at the country level have increased or remained stable in virtually all cases since the first SoS in 2015 (see Figure 43).

76. Utility performance improvements have been focused on management. Looking at the origins of the WUPI improvements points toward management practices as the main driver of the observed gains. As shown in Figure 44, indicators for metering, staffing, and collection of tariffs exhibit increased performance. There are also slight improvements related to service quality (service continuity), but virtually no progress with respect to service coverage, especially on access to wastewater collection and treatment services. This indicates that not only is the potential for performance improvements largest around service coverage but they also appear difficult to reap. Given that service coverage is often related to significant upfront investments, the lack of financial means might represent a key hindrance to the improvement of water sector performance in the Danube region.

77. The difficulties for utilities in increasing access to the services are most blatant regarding the collection and treatment of wastewater. So far, a total of €42.5 billion has been invested to implement the urban wastewater treatment directive in the region. Three-quarters of this amount was spent on sewer networks and the rest on wastewater treatment plants in the eight Danube countries that are EU member states (see Chapter VI). However, despite this important investment effort, an additional €17 billion (Umweltbundesamt and IOW 2017) is still needed to fund new investment in nonequipped agglomerations above 2,000 PE (two-thirds for sewers and the rest for wastewater treatment plants). The situation might be more challenging in non-EU countries, which face significantly larger investment needs and a lower level of economic development. The cost of UWWTD implementation for today’s candidate and potential candidate countries is estimated to amount to €19 billion (World Bank 2018).
78. The region’s utilities keep showing a converging trend toward better practices, except for a number of high performing utilities that performed slightly worse than in previous years (Figure 45). Utilities with lower initial WUPI grew stronger since 2013 than utilities with higher WUPIs. On the one hand, this confirms the finding of the previous SoS, showing that utility performance in the area is converging. On the other hand, there are a number of utilities with higher initial WUPI that at least slightly decreased their WUPI score. While the origin of this backsliding are beyond this report, it shows that achieving further improvements after a certain level may prove to be challenging. And a push toward the frontier utilities is not guaranteed.

79. The performance differences of utilities tend to be larger across countries than within countries. The crucial role of the country context for water utility performance is further highlighted in Figure 46. In most countries, the variation in utility performance is not very large, and most utilities fall into performance categories close to their average. This is most visible for countries with high or low WUPI scores. Despite the performance improvements in many countries, this picture is rather similar to the last report28. The water sectors in the region are converging, albeit at a pace that will still require several years before a level playing field is reached. At the same time, and this is particularly true for countries with intermediate WUPI scores, high and low performance utilities appear to coexist even within countries. This is particularly important because it indicates that in those countries, it is possible to perform at a high level, yet many utilities do not do so. This represents an important opportunity for possible efficiency potentials.
80. In general, high performing utilities score well across the three subdimensions29 of WUPI. On the country level for instance, Figure 47 shows that the top performers, the Czech Republic and Hungary, receive high scores (above 80) in all three areas. Similarly, utilities with low performance tend to exhibit weak performance in all three subdimensions.Between these two extremes, however, it appears that a considerable part of the performance gap to the best practice countries is driven by indicators related to service coverage, specifically wastewater collection and treatment.


81. Higher WUPI scores are strongly correlated with higher tariffs (measured as revenue per cubic meter of water sold) (Figure 48). Although this pattern might in part be related to economic development of countries, it suggests that increasing utility performance will go hand in hand with increasing tariffs. Within countries, higher tariffs do not necessarily mean better performance, but on the country level the relationship appears very clear. Linking tariffs with macroeconomic indicators (e.g., inflation) instead of ad hoc changes might be a sensible way to achieve enough financial means to achieve performance improvements.
82. Collecting sufficient revenue to cover at least variable cost is indispensable for high performance. Figure 49 shows that although there is a strong relationship between costs and revenue, the correlation is far from perfect. Many utilities do not collect enough revenue to cover operating cost. Second, utilities with tariffs that exceed cost tend to have higher WUPI scores. For a given cost level, utilities with tariffs above that level exhibit higher performance scores. Cost recovery is therefore not only a desirable goal in itself but also seems a crucial requirement for utilities to provide above average services. Given that tariffs in the region have stagnated or even decreased in some countries, the question arises whether the current level of revenues is enough to further improve services.

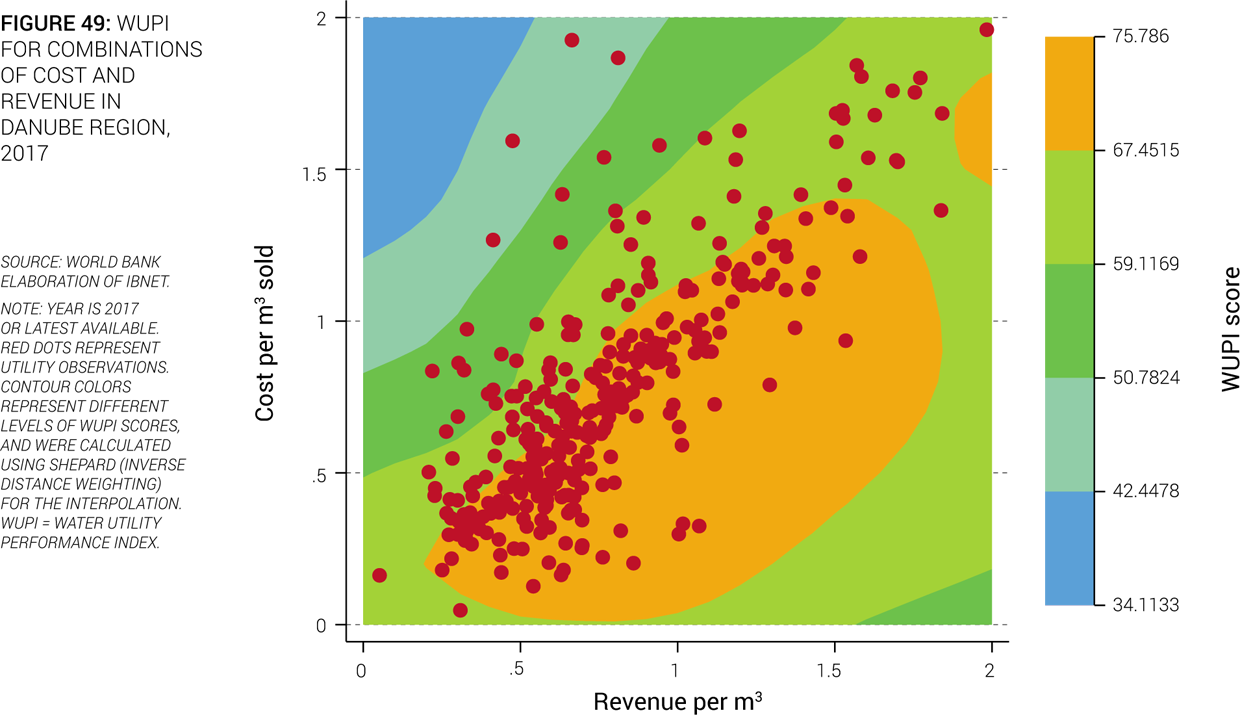
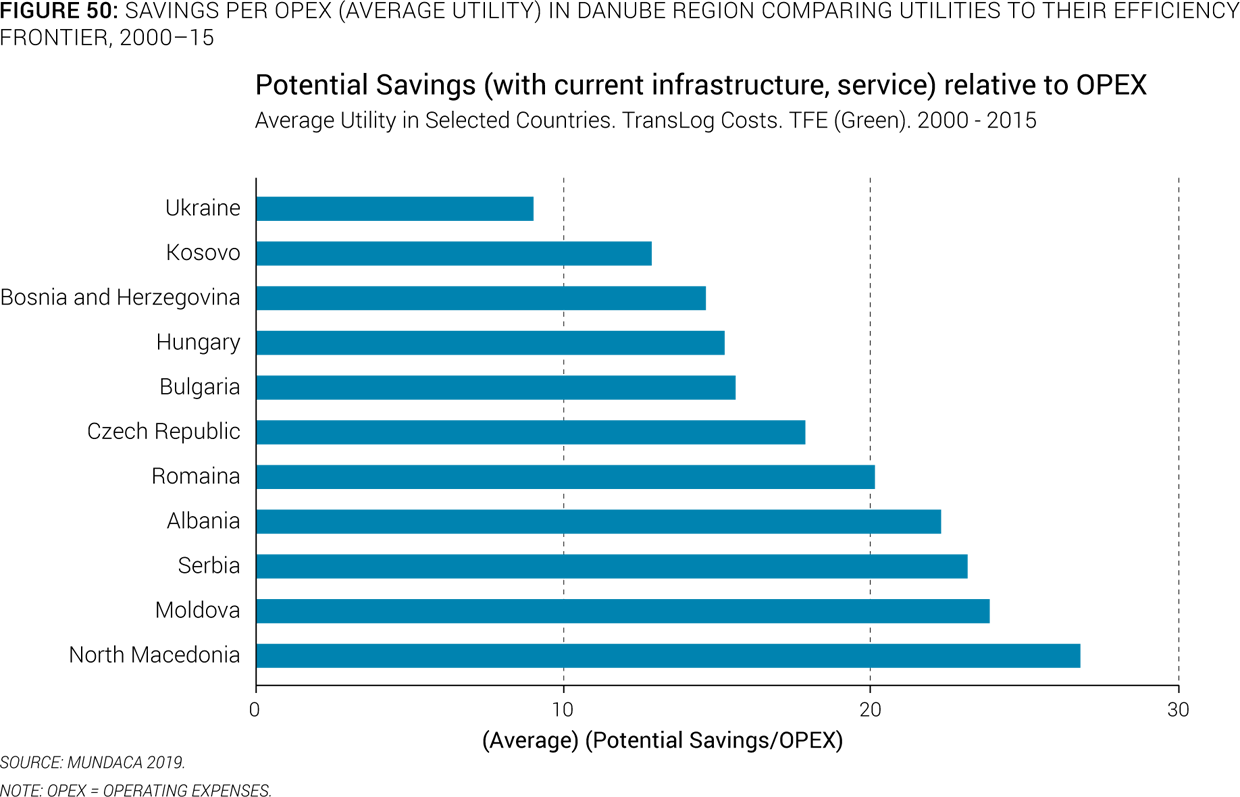
83. Improving cost efficiency could help to improve performance and maintain affordability at the same time. Another reading of Figure 49 suggests that costs are only weakly related to performance. For a given level of WUPI, indicated by the color of the contour plot, a wide variety of both low- or high-cost utilities can be found. While structural differences in the operating environment might drive this, this alludes to important cost efficiency potentials in the Danube area. As the results from Mundaca (2019) show, even under conservative assumptions, the potential cost savings amount to very large amounts. Figure 50 shows the average potential cost savings (in terms of opex) per country. The suggested range of 10 percent to 25 percent of opex is substantial and underlines the fact that increasing technical efficiency of utilities can bring quantitatively large benefits.
84. Increasing cost efficiency can help to pursue other goals. The analysis of utility efficiency in Mundaca (2019) indicates that utilities with higher cost efficiency can achieve better performance. A 10 percentage point increase in cost efficiency is related to a 5-point increase in WUPI scores. Higher cost efficiency can set free funds for improving utility performance (e.g., by raising service quality or connecting larger shares of population to the service). It might also make utilities more financially sustainable because cost-efficient utilities tend to exhibit higher cost recovery ratios.