A. Service Quality and Customer Practices
61. Five years ago, service continuity had reached or was moving toward reaching 24 hours per day in half of the Danube countries, two new countries have reached continuous water supply to the majority of citizens (Figure 31). The eight countries that provide 24 hours per day water supply have maintained this level of service over the past few years. In addition, Kosovo has managed to increase its average service continuity from 22 to 24 hours per day, and Moldova from 21 to 23 hours per day. Bosnia and Herzegovina, for which no data are available in 2015, shows a 24 hour per day continuity. Albania is struggling to improve continuity, staying at an average of 12 hours per day over the past five years, although continuity of supply is one of the key objectives of the country’s national water strategy (it was targeted to reach 20 hours per day in 2017). Data on continuity of water supply for Bulgaria and Romania are not available, as in the first SoS.
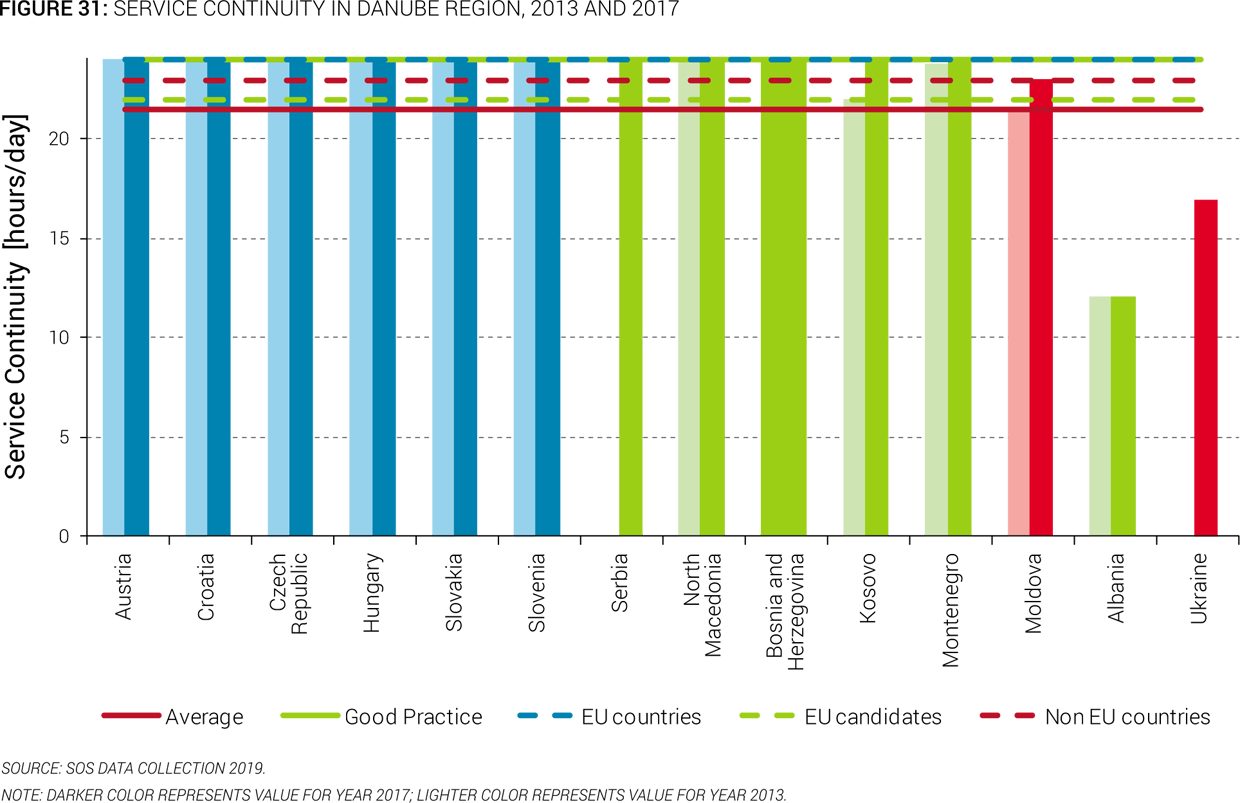
62. The level of service continuity achieved in Moldova, Bosnia and Herzegovina, and Serbia (Figure 31) should however be nuanced: it varies by type and size of service provider, especially in rural areas. Figure 32 shows that in rural areas, regional or stand-alone urban utilities provide 24/7 continuity to a larger share of their served population than do smaller providers, except for Albania and Moldova, in which community base providers seem to be reaching a larger share of their customers with continuous supply.

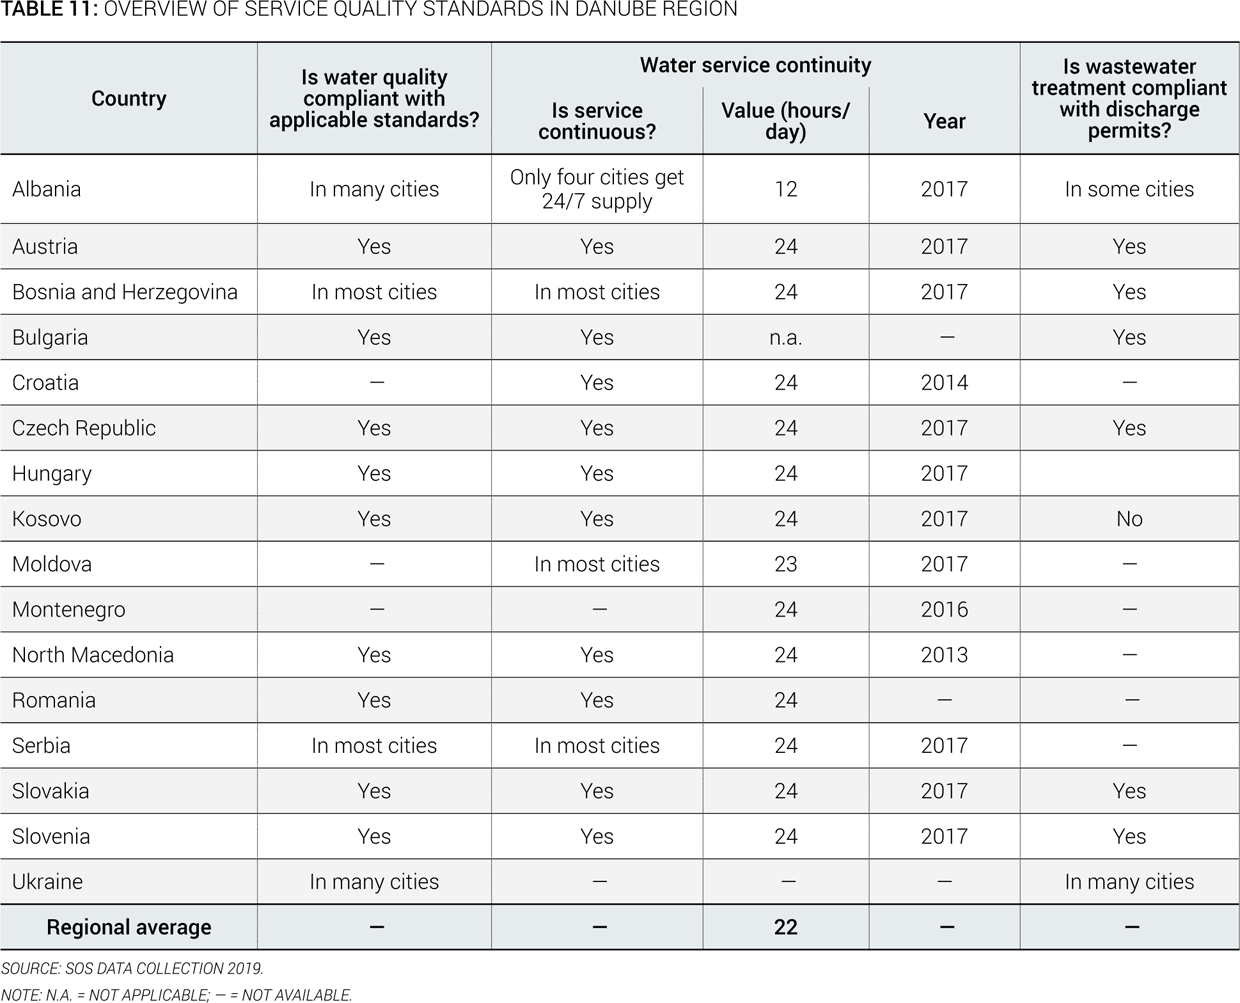
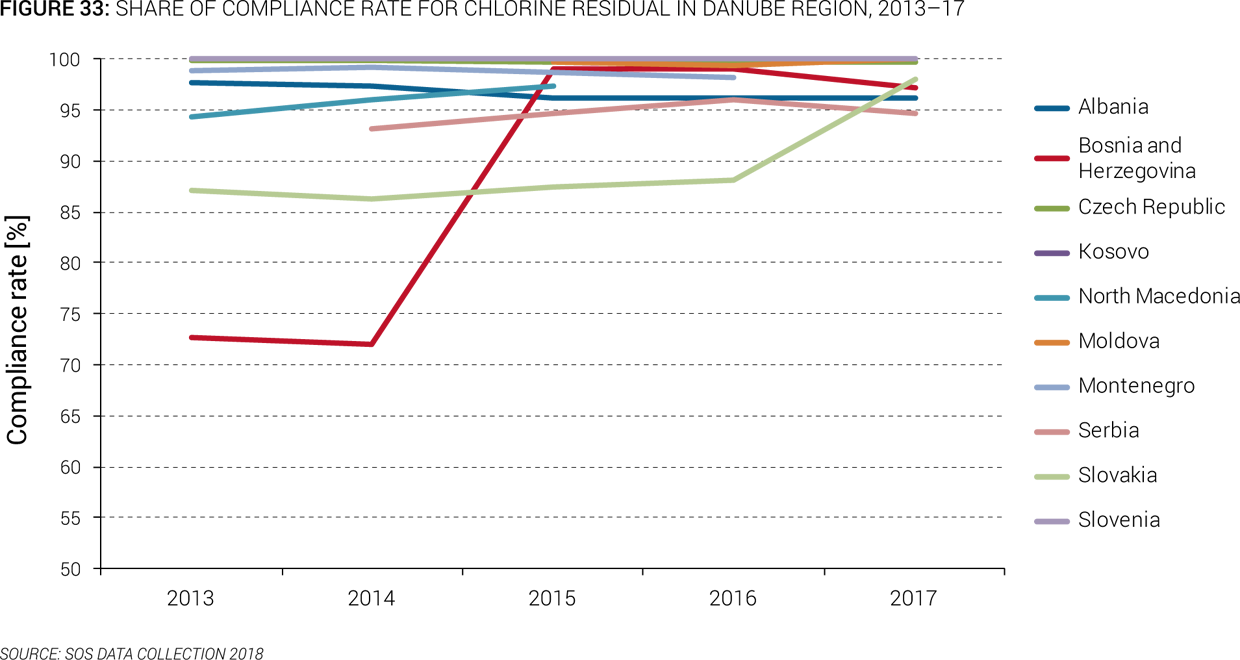
63. Drinking water quality is now compliant with national standards in the majority of countries and continues to reach EU standards in all EU member states (Table 11). In addition, candidate and potential candidate countries are making efforts to harmonize national standards with EU ones. Most countries with available data display compliance rates for chlorine residual above 94 percent, with remarkable progress being made by Bosnia and Herzegovina since 2014 (albeit a drop-in compliance in 2017), and by Slovakia since 2016. For coliform, compliance rates are above 97 percent except for Serbia, which is struggling to improve bacterial quality of drinking water above 70 percent, and has dropped slightly in compliance for chlorine residual in 2017.
64. For wastewater discharge, EU member states have transposed and are enforcing EU requirements, in accordance with the UWWTD, while other countries rely mainly on national standards inherited from the Soviet era. Some harmonization efforts with EU and World Health Organization (WHO) standards are being made in Albania, Bosnia and Herzegovina, Montenegro, North Macedonia, and Kosovo. Table 11 and Figure 33 provide an overview of the situation regarding service quality standards in the different countries for which information is available.

65. Over the past five years, metering level has increased in all countries, with few exceptions. Because of this positive evolution, 13 countries in the region are now displaying metering level above 90 percent. Three countries are still struggling to improve their level of metered consumption (Figure 35): Albania with 71 percent, Montenegro with 78 percent, and Ukraine with 42 percent. In Ukraine, the metering level is reported to have decreased by about 30 percent since 2013. This evolution might result from data inaccuracy, especially since metering levels reported in each oblast vary quite widely from one year to another in the same region. In Albania, the national strategy had planned massive metering installation investments from 2011 to 2017. But these investments did not occur, and full metering targets were not met. The new WSS strategy under development for 2019–30 is targeting universal metering by 2022. The average metering level in EU countries is 99 percent; it amounts to 87 percent in candidate and potential candidate countries and up to 67 percent in non-EU countries. Moreover, in Albania, Kosovo, North Macedonia, Moldova, Romania, and Serbia, the metering level increased and the share of population connected to public water supply rose as well. This shows substantial efforts from utilities to meter both historic and new customers.

66. Water consumption is generally following a decreasing trend, with significant reductions in per capita consumption in seven countries, slight (with one exception) increases in five countries, and remaining stable in another four over the past five years (Figure 36). In Montenegro, Ukraine, Moldova, and North Macedonia, consumption decreases range from 20 percent to 58 percent. In Ukraine, following the November 2013 political events and the hostilities in the eastern part of the country, inflation increased significantly, thus decreasing households’ purchasing power. As a result, the overall consumption went down, including consumption of water as well as other local public services. In Moldova and Montenegro, the significant increase in WSS tariffs, which more than doubled compared to five years ago, may explain the reduction in water consumption observed. On the contrary, consumption increased by 31 percent in Slovenia, with no clear explanation for such an evolution other than the increase of 13 percent in the population connected to public water supply at national level. The average water consumption is stabilized around EU-wide standards of 100 liters per capita per day to 120 liters per capita per day. The average consumption reaches 114 liters per capita per day in EU countries and 92 liters per capita per day in non-EU countries. It remains well above in EU candidate and potential candidate countries at 125 liters per capita per day.

67. Regional customer protection mechanisms and practices have not evolved significantly over the past five years. In nine countries, utilities have occasionally conducted customer surveys, but the results are rarely made public. In addition, those surveys are not very widespread or done regularly. In 10 countries, utilities are entitled by law to set up customer complaint mechanisms. Moreover, in countries with a national regulatory authority, the regulator is also responsible for customer protection, with the exception of Kosovo and Hungary, in which other institutions take on this duty (Table 12).
68. Over the past decade, customer satisfaction regarding water service quality has remained high or increased in most EU member states, but has dropped significantly in some EU members and in most EU candidate countries (Figure 37). In Austria, Slovakia, Hungary, Croatia, and the Czech Republic, customer satisfaction has remained stable at a high level (above 75 percent), and it has increased in Slovenia from 85 percent to 94 percent. However, satisfaction rate has decreased below 60 percent in Bulgaria and remains below 70 percent in Romania over the same period. In the other Danube countries, the customer satisfaction rate ranges from 51 percent to 72 percent (2018).

69. Customer satisfaction with regard to water service quality shows higher rates in rural settlements than in urban areas in two-thirds of the Danube countries (Figure 38). Over the past decade, in Albania, Ukraine, Bosnia and Herzegovina, Moldova, Austria, Bulgaria, Croatia, the Czech Republic, and Hungary, rural customers tend to be more satisfied about water service quality than urban ones. In Kosovo and Slovakia, the satisfaction rate between urban and rural customers tend to be similar whereas urban customers declare greater satisfaction in Slovenia, Serbia, Montenegro, and North Macedonia. These results (for which there was no breakdown available in the original SoS 2015) are counterintuitive because service provision in rural areas is less developed than in urban areas in many countries. This could be explained by a disconnect of perceptions on actual water quality, as well as by closeness to small service providers in rural areas and lower tariffs (World Bank 2018a).
