B. Services Expenditures: Operating and Investment Costs
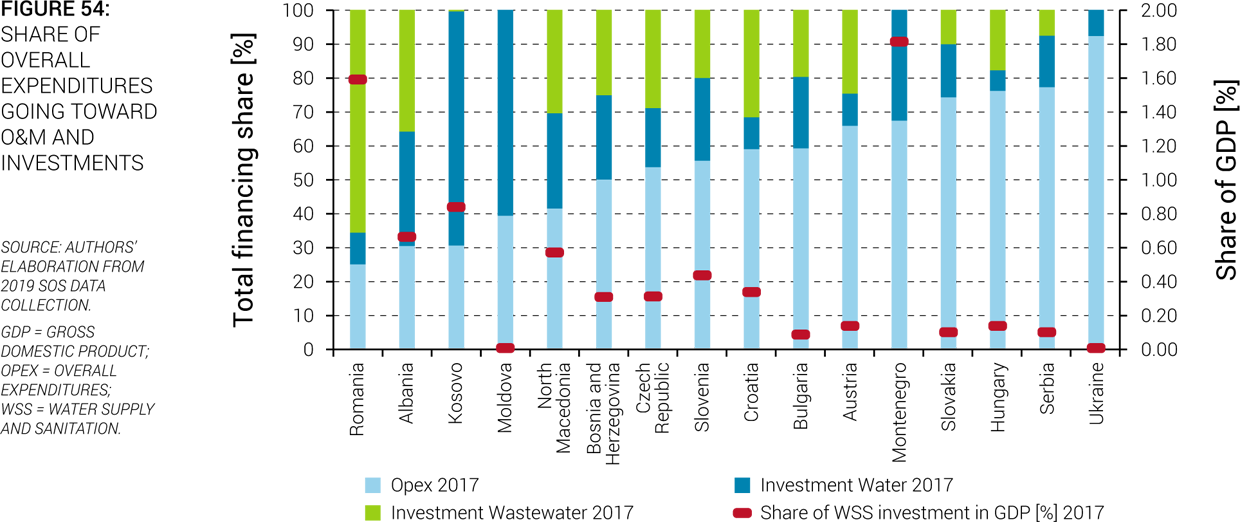
94. On average, the sector directs about half of overall expenditures toward operation and maintenance (O&M) infrastructure, and half toward renewal or expansion. Figure 54 shows the proportion of overall costs going toward O&M and toward investments for countries in the region. There is an important variation among countries, with the share of overall costs going toward investments varying between 19 and 75 percent. The superimposition of levels of investment (as a percentage of GDP) on the same figure logically shows that countries that have a very high expenditure going toward O&M are those that also spend less on investment overall, raising potential concerns about long-term service sustainability. Compared to three years ago, eight countries of the region have decreased the share of financing going toward investment, while it remained unchanged in Slovenia and Croatia and increased in the seven remaining countries (Table 16). Furthermore, the significant share of sector resources going toward investment shows the importance of carefully managing and developing assets and applying the principles of efficiency not only to the operation of water utilities but also to the planning and implementation of investment projects (see box 11). In that respect, the particularly low levels of investment (as a share of GDP) raises questions about whether assets are being properly managed and maintained in the long run or tariffs are maintained artificially low by living off assets, which will eventually result in reduced service quality.


Box 11 Investment Levels in the Water Supply and Sewerage Sector in Albania
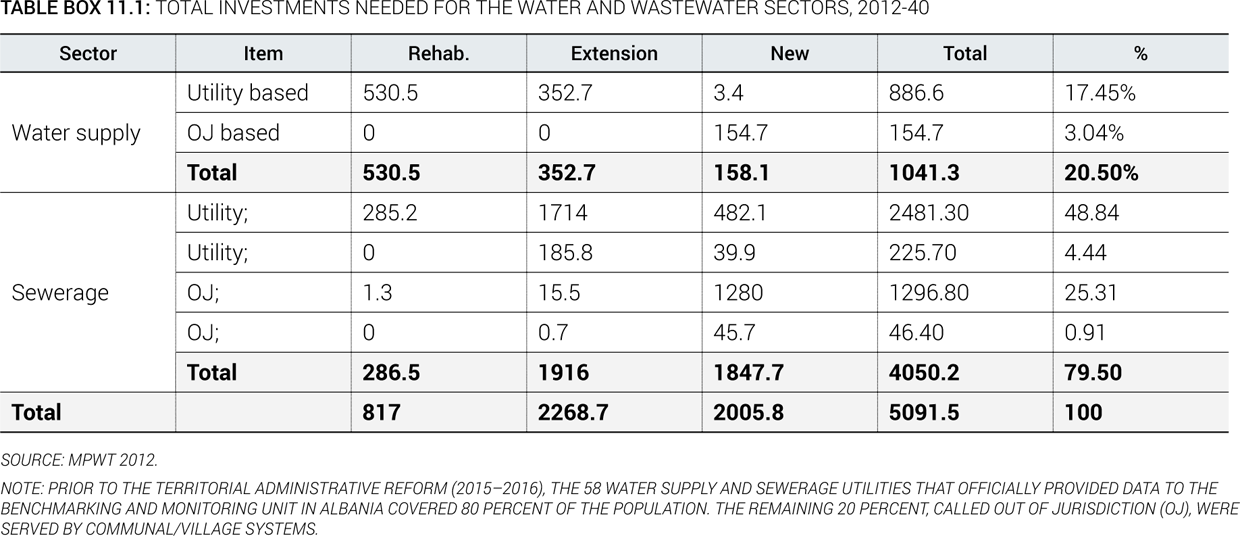
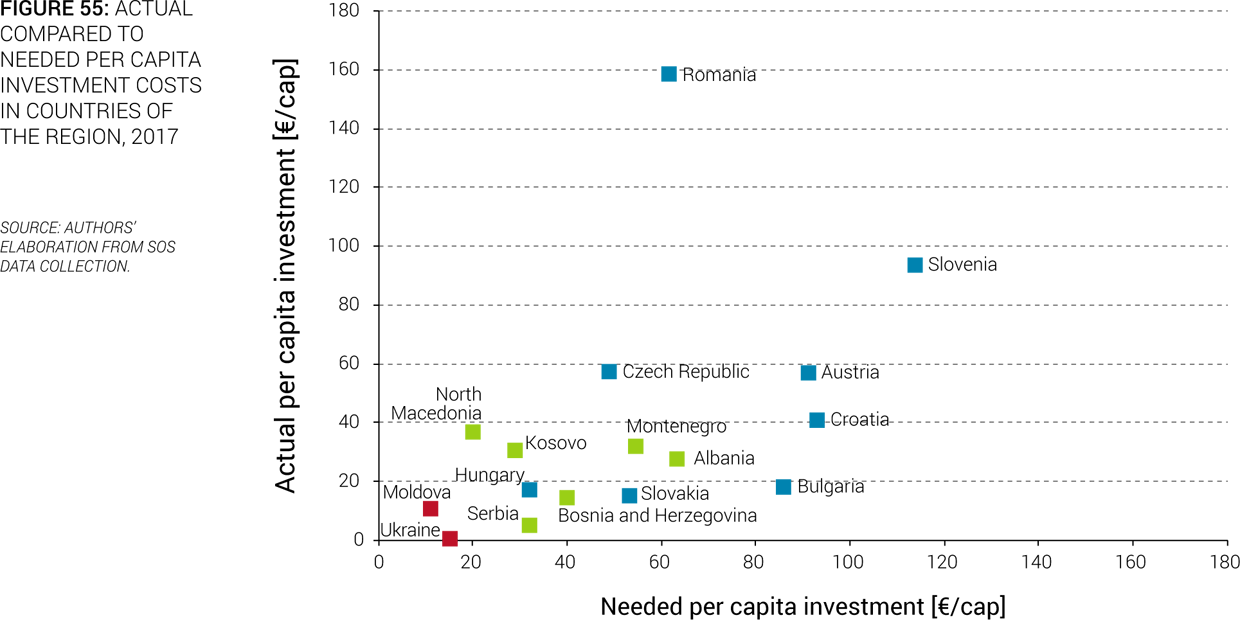
Demographic changes related to the rapid rural-to-urban population migration after the regime change in 1991, and the subsequent sharp increase in the demand for drinking water and sewage disposal services, have exacerbated the already precarious situation of the water supply and sewerage infrastructure, which is often operating at peak capacity. Although in recent years investments have been increasing, and recently more targeted toward wastewater, they were never sufficient to meet capital investment needs. According to the most recent information collected by the Danube Water Program, around €28 per inhabitant are invested yearly, financed from a combination of national and international sources. This amount remains well below the estimated €63 per capita per year needed to fund the investments (MPWT 2012) as stated in the National Water Supply and Sewerage Master Plan recently developed and approved by the government of Albania as a fundamental tool for national investment planning. The Master Plan is based on a sector analysis and considers national strategies and policies. It presents the total investments identified for both the water and wastewater sectors for 2012–2040 (see table). Through this tool, the elaboration of a priority ranking for the defined projects supports the sustainable use of investment funds in line with sector considerations and development policies. Based on priorities, a ranking according to short-, medium-, and long-term investment is defined by considering national and foreign investments for water and sanitation. Eighty percent of the identified investment needs is planned to go toward wastewater management (sewer extension and wastewater treatment plant construction), which is consistent with the country’s ambitions regarding EU integration.

95. Total water and wastewater investments in the region in 2017 cover less than 70 percent of needs estimated by the region’s governments to achieve EU or national targets (Figure 55). Governments or external financiers in most countries have estimated the amounts needed to achieve each country’s own targets or to comply with the EU acquis, and the combined national estimates amount to €5.5 billion of necessary investment annually. Overall, about40 percent of all investment needs are directed at water supply and compliance with the Drinking Water Directive (DWD), and 60 percent are for wastewater management and compliance with the UWWTD. Very large investment programs amounting to €3 billion in the last couple of years have been implemented in Romania to catch up for the delay in UWWTD implementation as full compliance was to be reached by end of 2018. Leaving aside this specific situation, the level of overall investment in the region is around €2.1 billion, which remains well below the needed €4.5 billion (for the region except Romania). Nevertheless, efforts have been made compared to five years ago as most countries have seen their level of investment per capita increased except Slovakia, Bulgaria, the Czech Republic, and Austria. However, for the latter two, the level of investment still remains among the highest of the region despite this decrease. In EU member states, investment per capita is twice as high as in EU candidate countries, underlining the costs associated with EU water legislation compliance. A total of €42.5 billion has been invested in total by the seven new EU member states of the Danube region, plus Austria, to implement the UWWTD. An additional €57 billion will be needed to reach and maintain full compliance until 2040, and new EU member states will have to mobilize significant additional funds, either from taxes or tariffs, in the next few decades to bridge the investment gap and remain compliant with the UWWTD. Total cost recovery achievement is a challenge in most countries of the region.


